Show code cell source
import networkx as nx
import matplotlib.pyplot as plt

G = nx.DiGraph()
G.add_node("Sensory", pos=(-2500, 700))
G.add_node("Cognitive", pos=(-4200, 0))
G.add_node("Frailty", pos=(-1000, 0))
G.add_node("Muscle", pos=(-2500, -700))
G.add_node("ADL", pos=(1500, 0))
G.add_node("Outcome", pos=(4000, 0))

G.add_edges_from([("Sensory", "Frailty")])
G.add_edges_from([("Cognitive", "Frailty")])
G.add_edges_from([("Muscle", "Frailty")])
G.add_edges_from([("Frailty", "ADL")])
G.add_edges_from([("ADL", "Outcome")])

pos = nx.get_node_attributes(G, 'pos')
labels = {"Frailty": "Frailty\n(Phenotype)",
          "Sensory": "Sensory\n(Acuity)",
          "Cognitive": "Cognitive\n(Tasks)",
          "Muscle": "Muscle\n(Strength)",
          "ADL": "ADL\n(Independence)",
          "Outcome": "Outcome\n(Hard Endpoints)"}  # Added label for "NDI" node in the labels dictionary

# Update color for the "Scenarios" node
node_colors = ["lightblue","lightblue", "lavender", "lightblue", "lightblue", "lightblue"]
# node_colors = ["lightblue","lavender", "lavender", "lightgreen", "lightpink", "lightpink"]
# Suppress the deprecation warning
import warnings
warnings.filterwarnings("ignore", category=DeprecationWarning)

plt.figure(figsize=(10, 8))
nx.draw(G, pos, with_labels=False, node_size=20000, node_color=node_colors, linewidths=2, edge_color='black', style='solid')
nx.draw_networkx_labels(G, pos, labels, font_size=14) # , font_weight='bold'
nx.draw_networkx_edges(G, pos, edge_color='black', style='solid', width=2)
plt.xlim(-5000, 5000)
plt.ylim(-1000, 1000)
plt.axis("off")
plt.show()
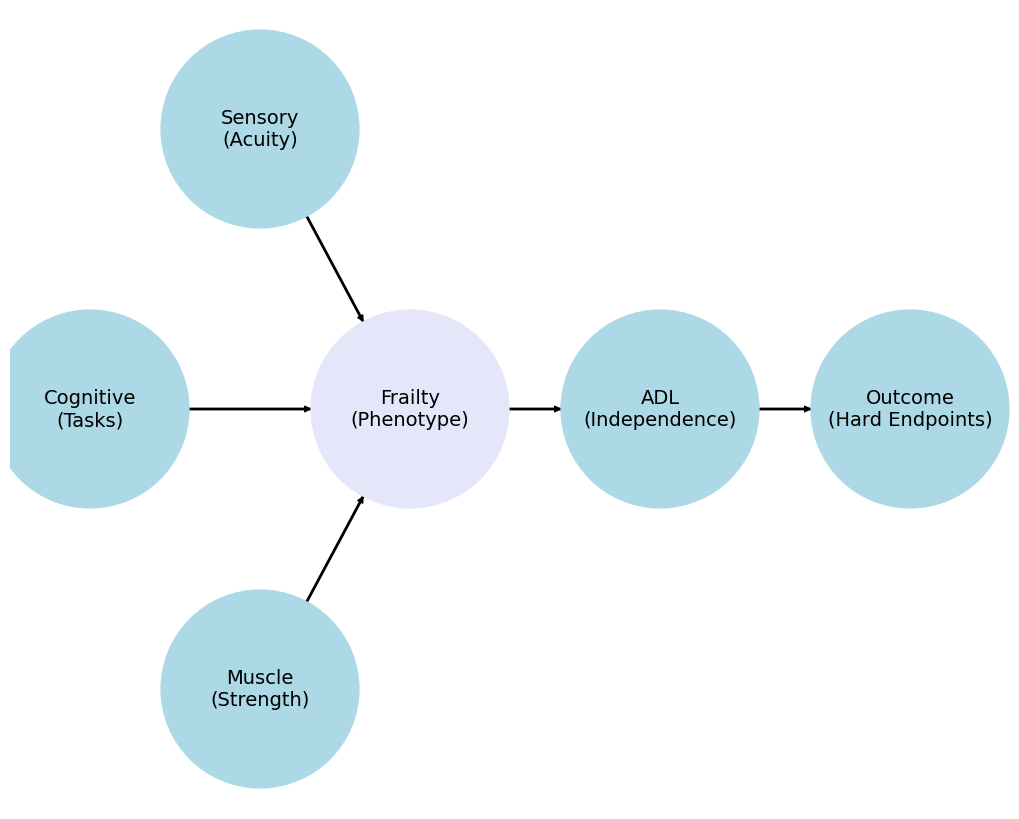
Background#
Aging and disease are associated with decline in functional reserve capacity
Earliest manifestations are reduced sensory acuity, cognitive decline, and sarcopenia
Ultimately these lead to manifestations of the Physical Frailty Phenotype:
Energy
Self-reported fatigue
Low physical activity
Mass
Unintentional weight loss (Sarcopenia)
Weakness (Grip strength)
Speed
Walking speed over given distance
Older living kidney donors are healthy, screened individuals
Screen would exclude those with above symptoms at baseline
However, nephrectomy is a 50% reduction in structural reserve capacity of the renal system
Renal system is central to various homeostatic and functional processes:
Phosphate excretion Mineral and bone disorder (CKD-MBD)
Susceptibility to bone fractures
Vascular calcifiction
Cardiovascular disease
Systemic hypertension
Other extra-renal complications of CKD
Decreased clearance of prescribed drugs
Vulnerability to delirium
Adverse reactions to contrast media following diagnostic procedures
Incidence of Diabetes and Hypertension
Higher risk with age and after donation
Risk factor for kidney disease
May sooner reach ESRD because of low eGFR baseline after nephrectomy
Quantify nephrectomy-attributable risk of ESRD and mortality
Can accrutely quantify these hard outcomes in older donors over 30 years and at a national level
We do so for both donors and nondonors
Describe the prevalence of hospitalizations in older donors vs. older nondonors
Upstream of ESRD is CKD and other clinical syndromes that are less robustly captured by national databases
Most databases do not capture frailty, its risk factors, and downstream effects on activities of daily living
Aging cohort of donors will leave a footprint of present and
missingdata crucial for planning better studies
Implement a risk calculator for ESRD, mortality, and sentinel hospitalization in older donors
Seek to make the general public the “end-user”
Personalize risk estimation
Set to outcomes that matter to older donors